The original dataset is here.
Was necessary to cleaned the data and working with it previously for this analysis, all of the full code is here.
The libraries that I used were:
We have 5 datasets :
- Clean_life_expectancy : The provided dataset for life expectancy, cleaned and updated
- Clean_life_expectancy_Melt : Contains the same info that clean_life_expectancy but with the years columns melting into rows
- Clean_fertility : The provided dataset for Fertility, cleaned and updated
- Clean_fertility_Melt : Contains the same info that Clean_fertility but with the years columns melting into rows
- metadata : Special dataset that contains information that link the country with regions an incomes types
Quick Inspection of the datasets
Merging life_expectancy, fertility and metadata datasets
By region and income
Grouping life and fertility by its median
Verifying Life expectancy over the years
As we noticed the life expectancy are incremental with the time
Verifying Fertility over the years
Fertility is decrementing over the years , this suggest a negative correlation with life expectancy
Verifying the relation between life expectancy and fertility over the years
This confirms the idea that life expectancy and fertility are negative correlated
Verifying if the correlation is negative in all the regions
Obtaining all the regions
Displaying the life expectancy and fertility over the years by region, also showing the correlation by region
As we can see the life expectancy- fertility relation is stable from 20-60 years but passing this threshold, the fertility starts an aggressive decrement, we could check this specially in North America and Europe
Verifying if the correlation is negative with incomes types
Obtaining all the incomes types
Displaying the life expectancy and fertility over the years by incomes types, also showing the correlation by incomes
As we can see the relations between life expectancy and fertility with the incomes types keeps the same behavior like the regions. Here we can noticed that when the income increase the life expectancy increase too and fertility decrement, again with the threshold of 60 years
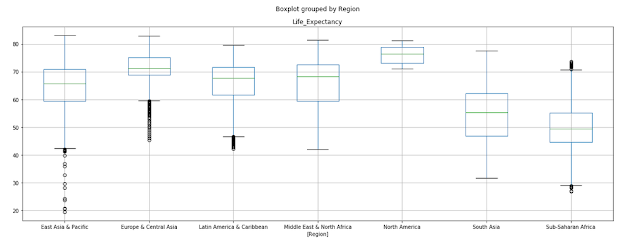
Verifying Central Tendency measures by regions
Apparently the most stable region is North America, in the opposite, Asia and Africa suffers by outliers,this could be explain because some countries of this regions are rich and others poor, for example in Africa the differences between South Africa and Somalia are too bigger
Verifying which group(region or income) affect more the relation fertility-life expectancy
Creating a 7 centroids knn cluster (simulating the 7 regions)
Creating a 4 centroids knn cluster (simulating the 4 incomes)
The cluster that obtains a better inertia was the 7 centroid, now we create a hierarchical cluster and determine which distance could provide us similar number of clusters
As we can see with a distance of 9 we have been able to obtain the exact number of desired clusters (7)
Now is time to analyze the information provided by the hierarchical clustering
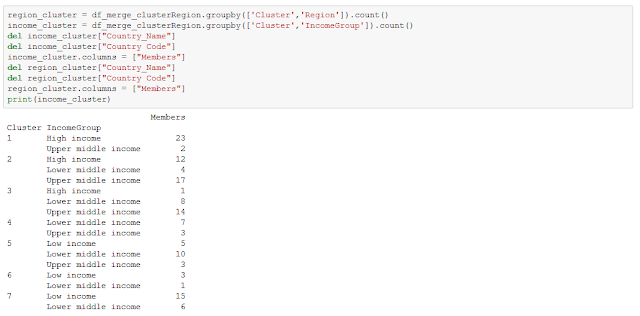
The next table shows the joining info between the hierarchical clustering and the data provided by the metadata
Grouping the info by income
Grouping the info by Region
Interpretations :
- We can group the cluster 6 and 7 into one because they are affected in the same manner by the region and the income (Sub-Saharan Africa, South Asia)(Low income,Lower middle income).
- The clusters 1 and 4 explain better its fertility-life relation for its incomes that for its regions.
- Both, regions and incomes can explain in certain way the relation fertility - life expectancy, this is possible because some regions has a clearly determine kind of income, for example the mayority of the countries of africa has low incomes in comparision with europe
- When the income increase, the fertility suffer a decrease and the life expectancy increase
- When the income decrease, the fertility suffer an increment and the life expectancy decrease
- Based of this results apparently is more important the incomes , that is to say, the relation between fertility-life expectancy by region is just explained by the incomes of the region


